Dashboard
The dashboard provides all the information and controls required during the scan.
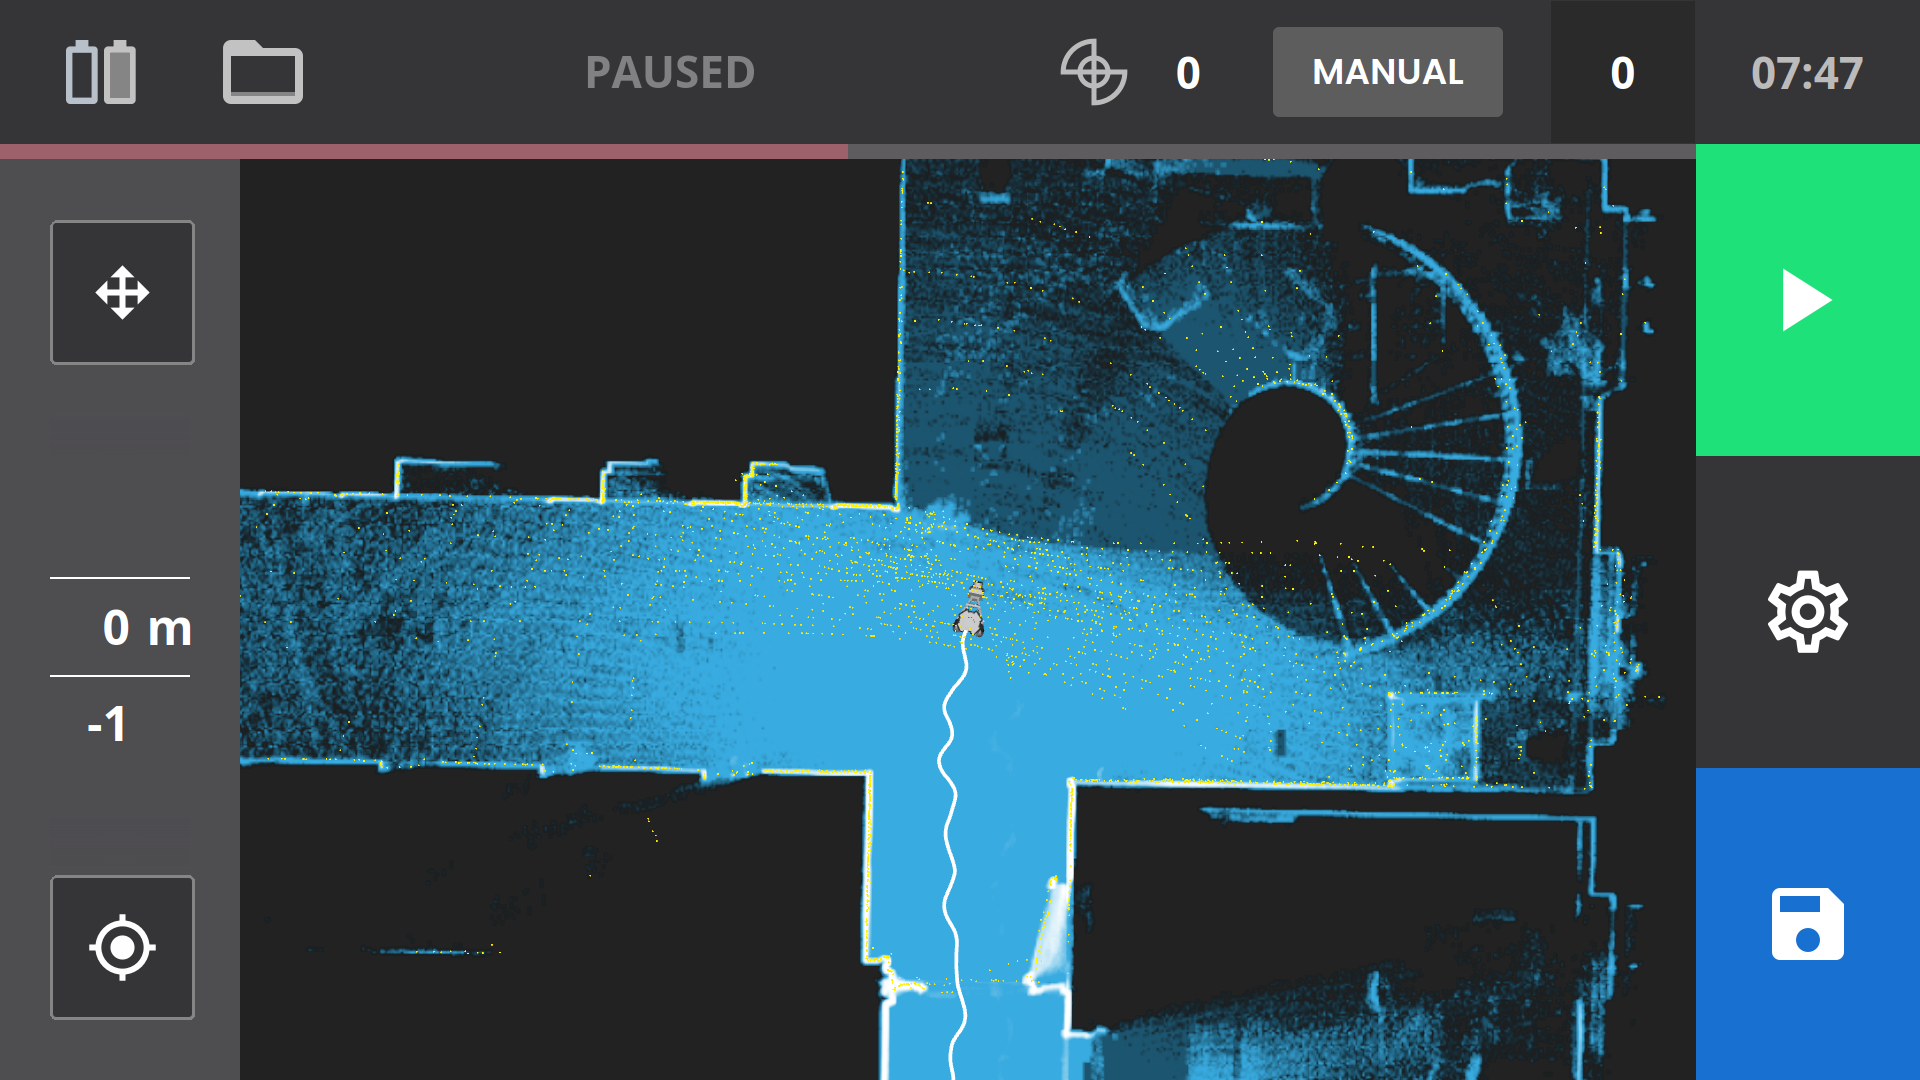
The NavVis VLX Dashboard shows the following information:
- The battery icons indicate the charge level of both batteries (each battery indicator turns red when the battery capacity drops below 20%). When the battery is empty, a warning indicator (!) appears on the battery icon to indicate it needs to be replaced.
- The folder icon indicates the remaining storage space on the SSD.
- The control point icon with the number of control points recorded.
- The Start and Pause icons.
- The Settings icon
- The thumbnail image that shows the last image recorded and the total number of images recorded in the dataset.
- Camera status: AUTO = automatic camera triggering, MANUAL = manual camera triggering, PAUSE = no data (point cloud) captured, automatic camera triggering disabled.
- The number of control points captured.
- Time elapsed since the beginning of the scan.
- A color indicator bar that turns red if the user is walking too fast (both forward/backward and rotation).
- The pan and rotate button at the top left to pan or rotate the live map.
- The recenter button at the bottom left to recenter the live map.
- The vertical view slider on the left changes the view of the scanned dataset vertically in meters (only visible when the scanning is paused).
Note: If the speed indicator turns red, it means that the user is moving so fast that the quality of the dataset might suffer. Move or rotate more slowly.
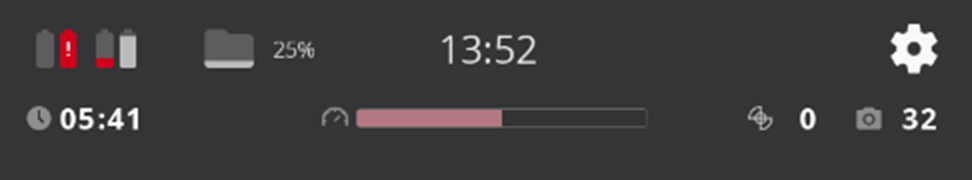
At the top of the dashboard, the status panel keeps track of:
- The battery level (the indicator turns red once the battery capacity drops below 20%). When the battery is empty, a warning indicator (!) appears on the battery icon to indicate it needs to be replaced.
- How much storage space is available on the SSD (folder icon).
- The current time.
- Time elapsed since the beginning of the scan.
- Current speed (both forward/backward and rotation).
- The number of control points captured.
- The number of panoramas in the dataset.
Note: If the speed indicator turns red, it means that the user is moving so fast that the quality of the dataset might suffer. Move or rotate more slowly.
In the event of problems, various warning notifications may be output (see warning messages).